Riverstock
Hydrology model, in progress
- Since
- 2026
- Status
- Model and data pipeline built, app in progress
- Platforms
- Server, iPhone, in progress, Raspberry Pi display, in progress
- Built with
- Python, PostgreSQL and TimescaleDB, SwiftUI
Riverstock is a model of the Little Red River below Greers Ferry Dam. It answers one question: how deep will the river be at your access point, at the hour you plan to be standing in it? The model and data pipeline are built and tested, and the API and apps come next. One finding already matters. The release wave reaches Ramsey Access in a median of twelve hours, not the eight hours anglers repeat.
The reach below the dam has two gauged points, the dam tailwater and Dewey at mile 29.5, and every access people fish from sits between them. The model routes each generation release down the river and gives each access a discharge, an arrival time, and a wadeability class with the discharge printed beside it, because the wadeable threshold is still being measured.
Water temperature is measured at the same two points. Between them the model draws a straight line and says so, and the measured means show why that is only a start: the river warms toward Dewey in summer and runs colder there in winter.
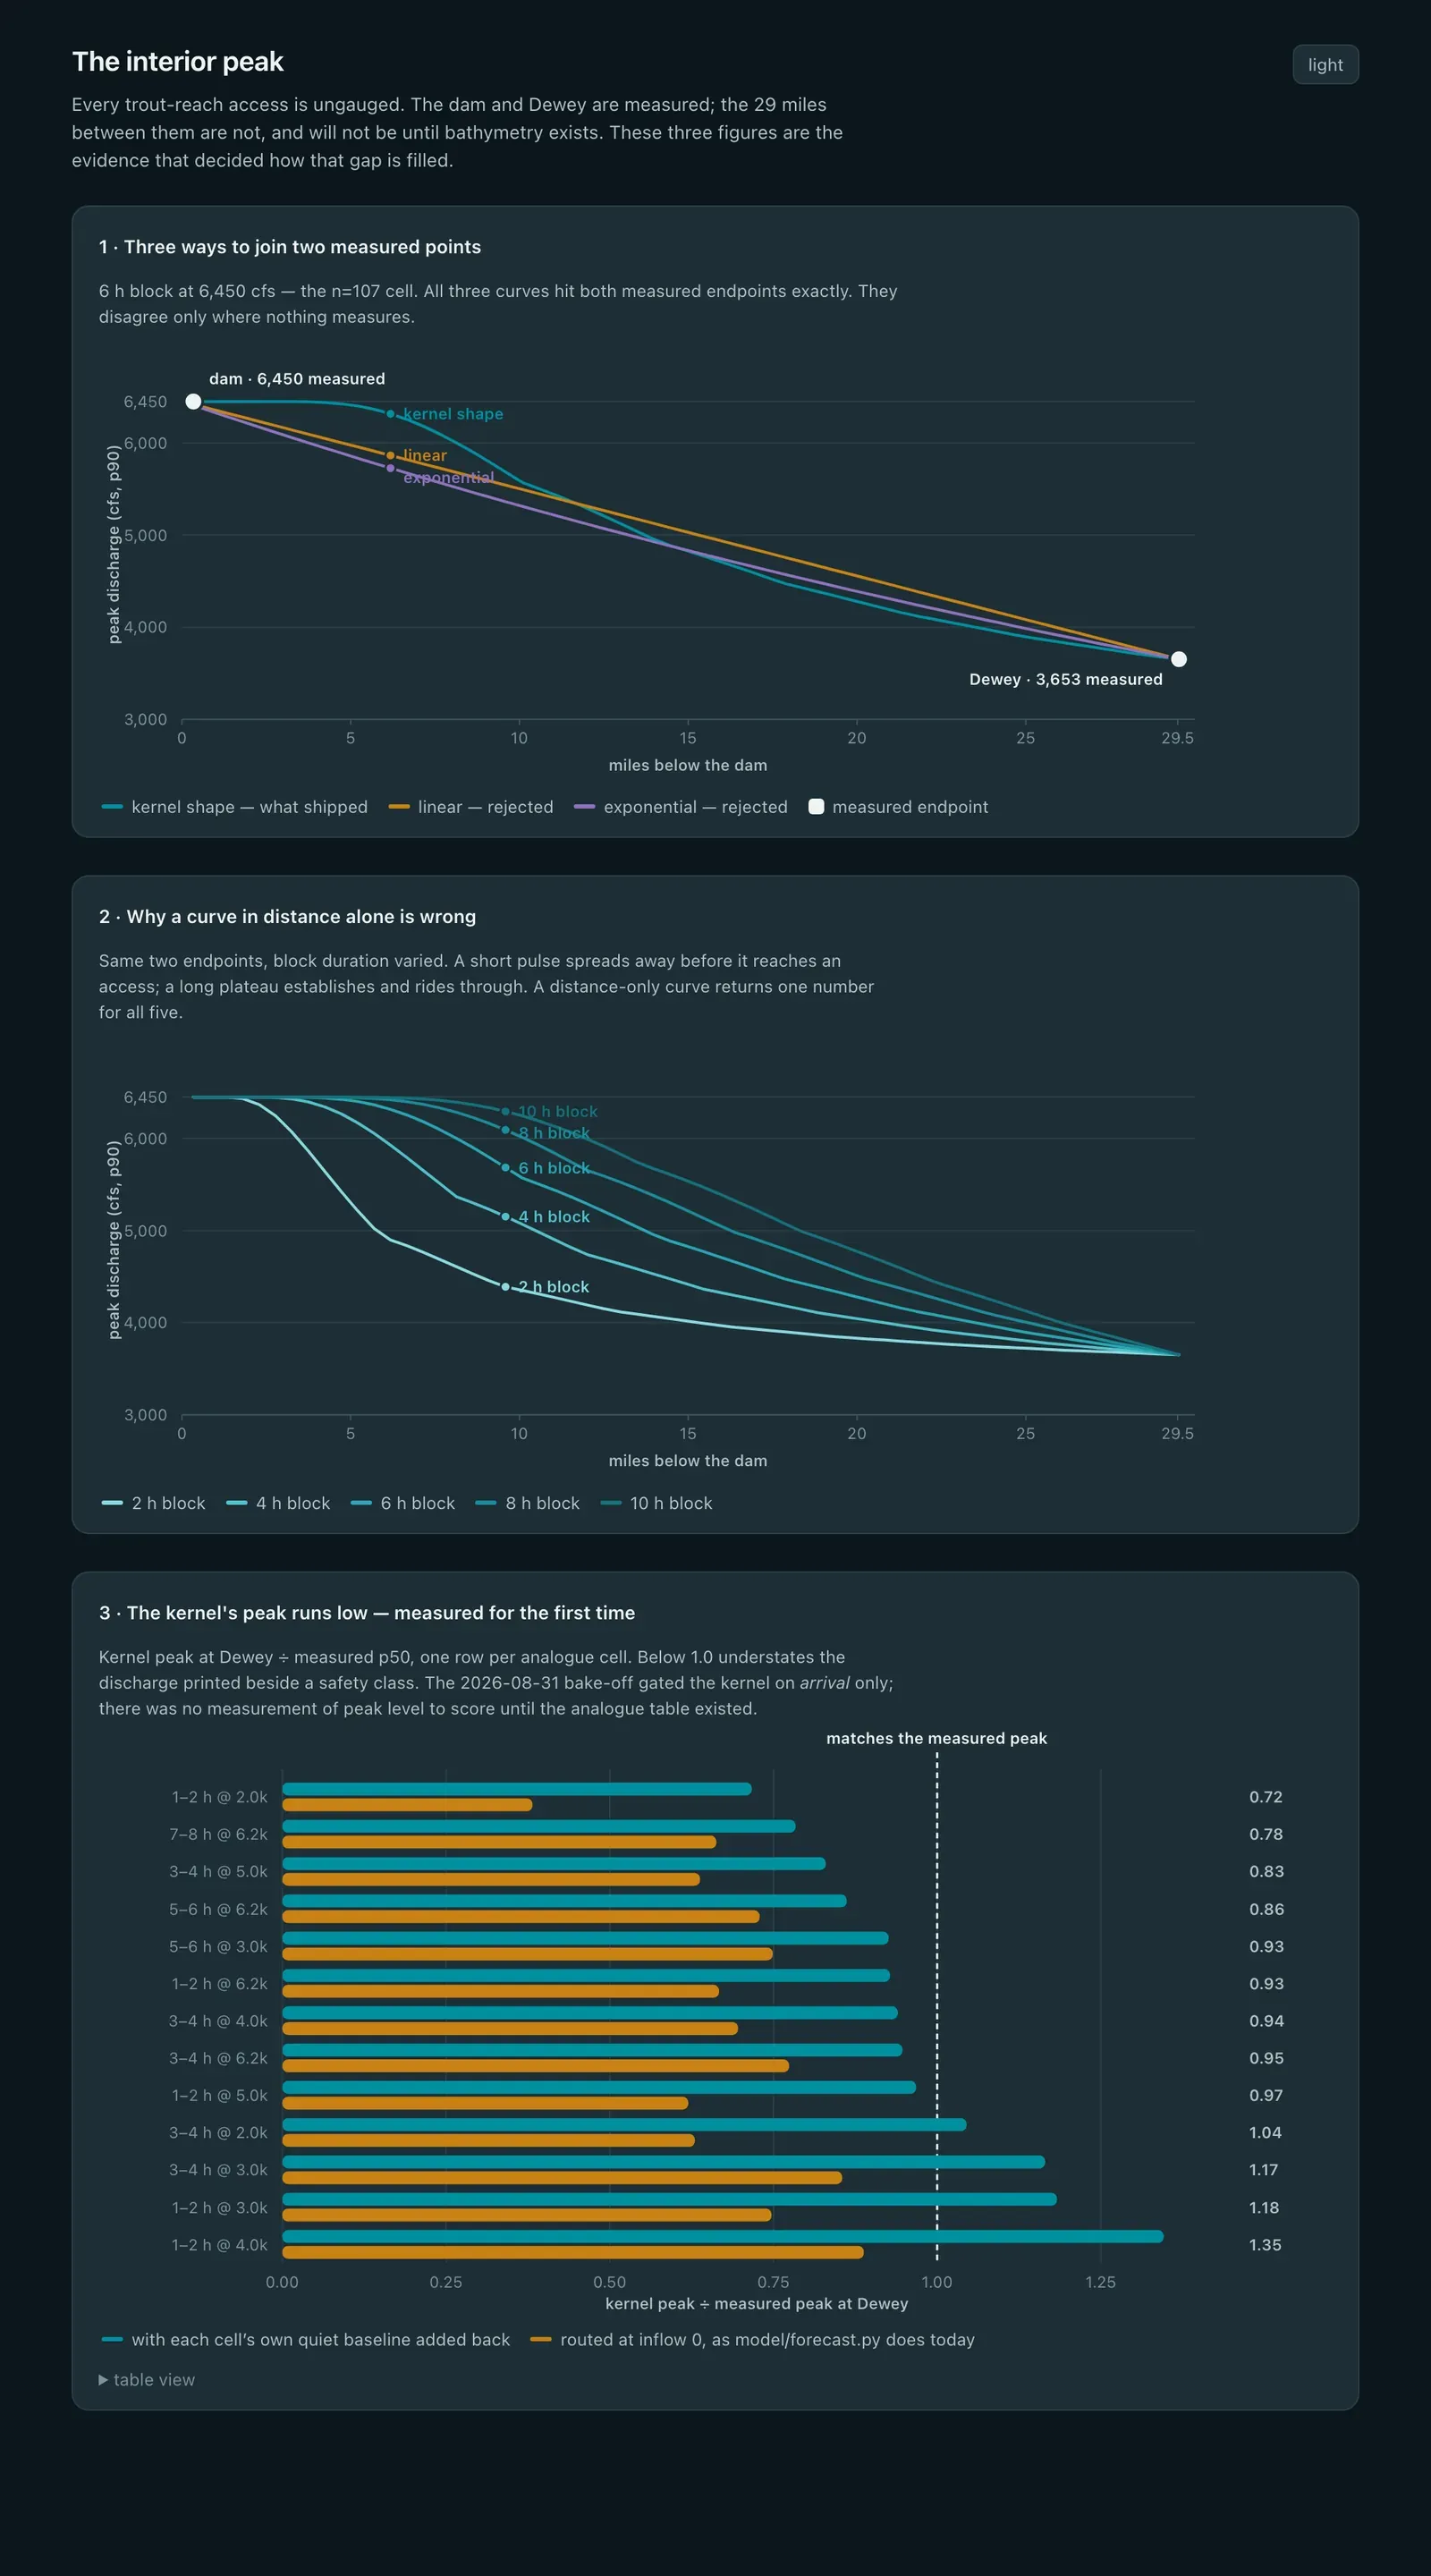
It is a Python model on PostgreSQL with TimescaleDB, fed by the USGS water data API, the Corps of Engineers, and the power administration’s generation schedule. The figure below is from the model’s own documentation: three ways to join the two measured points, why a curve in distance alone is wrong, and how the chosen kernel’s peak compares with the measured peak at Dewey.
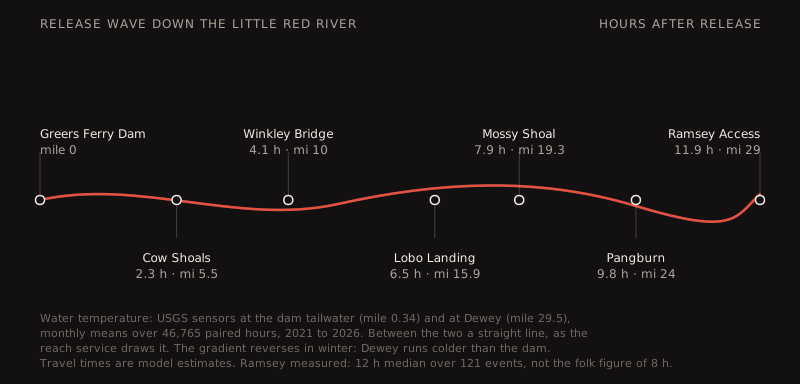
The release wave, one loop per month. Water temperature is measured at the dam and at Dewey; between them it is a straight line.